
- Success Stories
- Satellite Science & Environmental Intelligence
NOAA’s Updated Climate Atlas Tool is Now Live!

In the fall of 2026, NOAA released the updated Climate Atlas tool. CSS is proud to support the release of this tool, with personnel as key members of the leadership, development, and user engagement teams.
Climate Atlas offers enhanced accessibility and usability for local communities, businesses, industries, and decision-makers. Reliable climate data underpins strategic planning, risk management, and everyday decisions. When translated into practical use, these insights help industries strengthen operations, minimize risk, and build long-term economic resilience.
Several types of maps help visualize climate data:
- Averages and Totals: Show mean, maximum, and minimum temperatures, as well as total precipitation over a selected time period.
- Normals: Represent long-term averages (typically over 30 years) to establish a baseline for temperature and precipitation.
- Anomalies and Ranks: Highlight departures from typical conditions and show how values compare across the full historical record.
- Degree Days: Measure how daily temperatures differ from 65°F, a standard baseline used to estimate heating and cooling needs.
- Thresholds: Track how often conditions exceed or fall below specific values, helping identify extremes.
- Annual Events: Provide insight into key climate milestones, such as the first fall freeze, the warmest day of the year, and the coldest day of the year.
Collaborative Development with Industries
Through direct collaboration with stakeholders, the Climate Atlas tool is designed to better meet real-world needs while improving usability, accessibility, and functionality. It provides consistent, regularly updated information that can be utilized for risk assessment, infrastructure planning, and strengthening resilience to extreme weather events. Features such as anomaly maps, normals, and threshold analyses offer context for interpreting weather patterns.
This means meaningful impact for:
- General industry and public leaders to use temperature averages, climate normals, thresholds, and degree day data to guide infrastructure planning, energy management, and community preparedness. City planners might use long-term temperature normals to design weather-resilient urban spaces, while utility companies utilize temperature trends to forecast energy demand and avoid outages.
- Architecture and engineering professionals who can apply temperature trends and degree day data to design energy-efficient buildings, select weather-appropriate materials, and plan resilient infrastructure. For example, engineers can use cooling and heating degree day projections to select HVAC system sizing for a building.
- Insurance and reinsurance organizations that can use thresholds, annual events, and historical patterns to strengthen risk modeling, and better understand exposure to weather-related events. Analyzing extreme temperate events can help estimate infrastructure and health-related claims.
- Retailers to integrate weather insights into inventory planning, promotions, and logistics, so retailers can respond more quickly to variability and optimize sales and customer satisfaction. For example, cooler winters can shift the need of winter apparel to transitional seasonal clothing.
Turning Data into Action
CSS is proud to work alongside NOAA, providing skilled professionals who are helping to develop and deliver solutions like the Climate Atlas tool. Through this partnership, complex environmental data is translated into accessible, user-friendly insights that empower organizations to plan ahead, manage risk, and respond effectively to changing conditions.
Photo credit: NOAA Photo Library, Flickr
See More CSS Insights
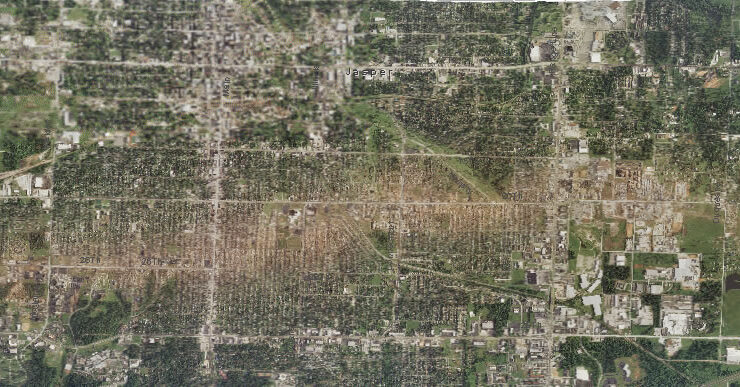
Providing Data Products for More Effective Consumption
The National Oceanic and Atmospheric Administration’s (NOAA) National Centers for Environmental Information (NCEI) is responsible for providing data, products, and services that help businesses and organizations operate more efficiently and effectively. As such, these data and products need to be available in a publicly accessible and digestible format the audience are able to understand. To…
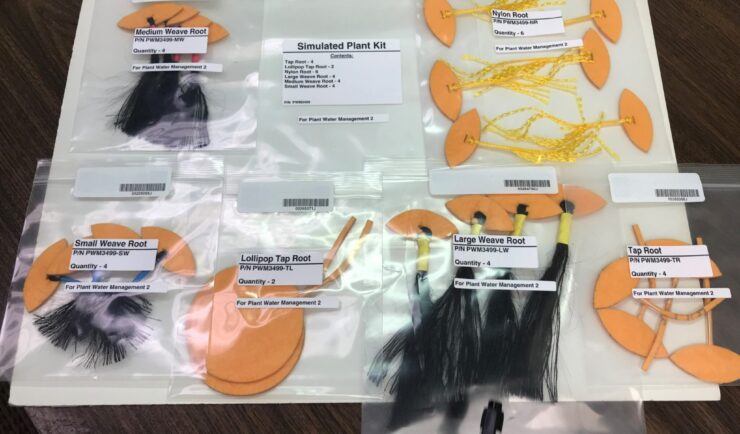
Astronauts Conduct Latest Plant Water Management on the International Space Station
NASA recently performed the sixth iteration of the CSS-supported Plant Water Management experiment on the International Space Station (ISS).
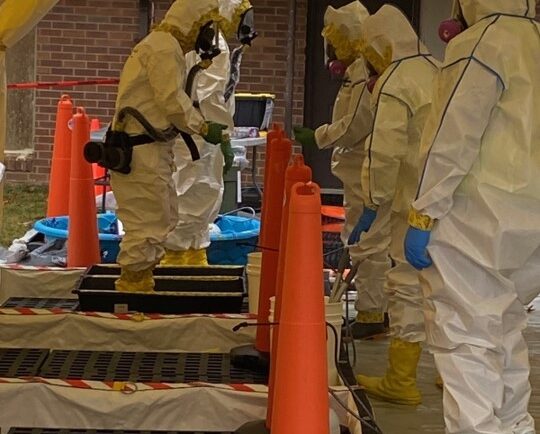
Developing a Decontamination Line Guide for EPA Responders
CSS employee owners supporting the Environmental Protection Agency’s (EPA) Scientific and Technical Assistance for Consequence Management (STACM) contract have been working with the National Chemical Preparedness Workgroup and Sub Workgroups to create a decontamination (decon) line guide and detailed drawing for EPA on-scene coordinators and EPA’s special teams to use for emergency responses and incidents. The…