
- Success Stories
- Emergency Preparedness & Response
Training Staff for Handling Hazardous Waste and Responding to Chemical Spills
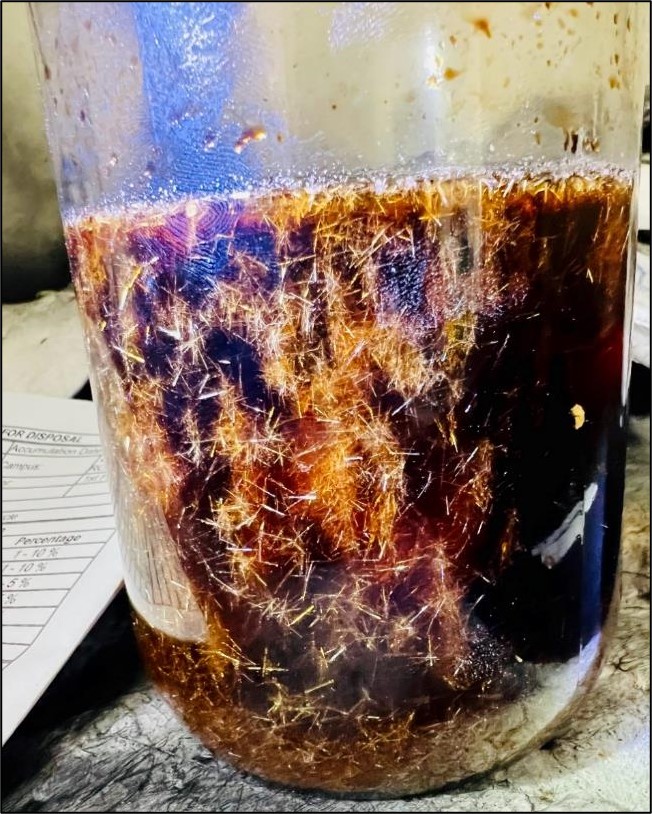
CSS employee owners provide on-site support to the Centers for Disease Control and Prevention (CDC) Hazardous Waste Program at several campuses around the country: Atlanta, Georgia, San Juan, Puerto Rico, and Fort Collins, Colorado. With 22 years of experience, CSS staff are responsible for providing training to laboratory and facilities staff to ensure safe handling of hazardous waste to avoid harmful incidents.
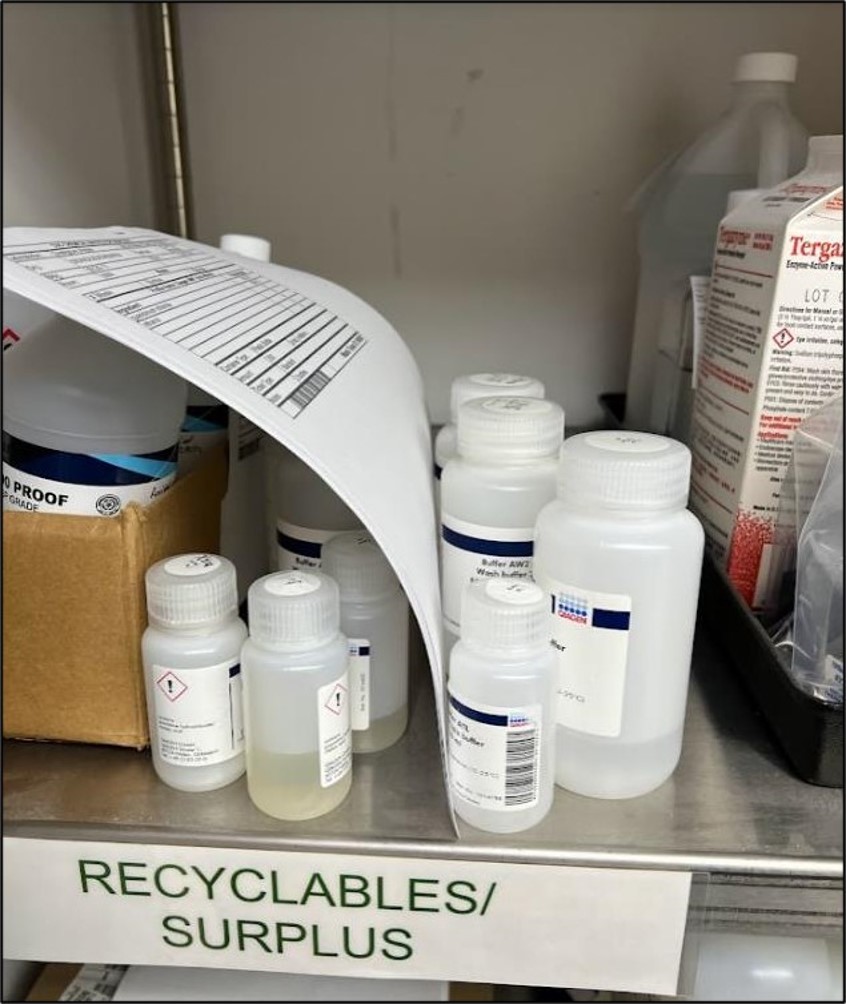
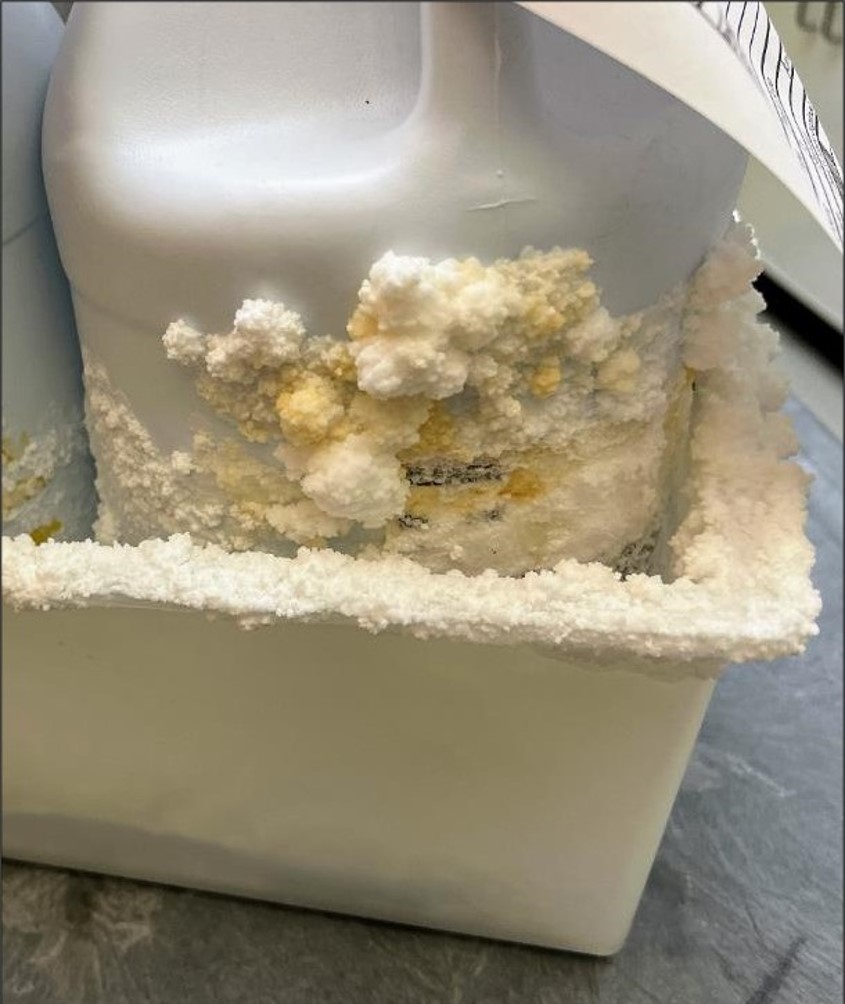
CSS staff provide regular training to CDC staff on topics, including hazardous waste management, using the online waste ticketing system, and spill training. This training covers common mistakes (e.g. improper placement of labels), safety issues (e.g. not including biological materials, improper storage and containment, leaks, and classification), and handling special waste, such as crystalized waste (which can be unstable and possibly explosive).
Additionally, CSS staff provide universal waste training to CDC staff on an as-needed basis.
See More CSS Insights
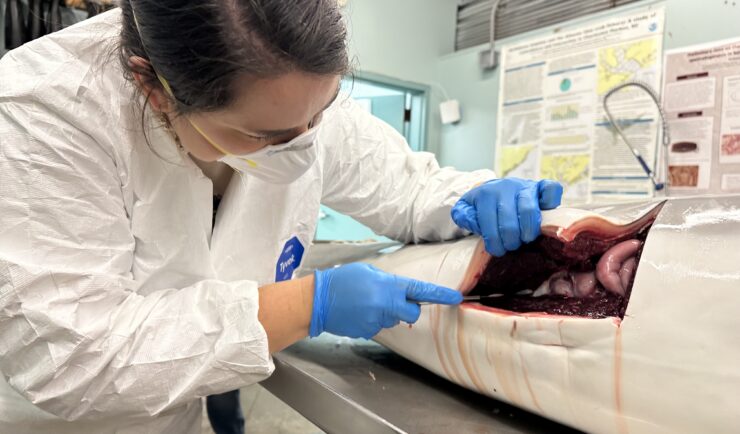
Assisting South Carolina Marine Mammal Stranding Network
CSS employee owner and Marine Mammal Microplastic Specialist supporting NOAA’s National Centers for Coastal Ocean Science assists the South Carolina Marine Mammal Stranding Network in responding to dead marine mammals when they strand on beaches or estuaries throughout South Carolina. This is work is critical for human and environmental health because it provides invaluable samples…
Monitoring Air Quality in California’s San Joaquin Valley
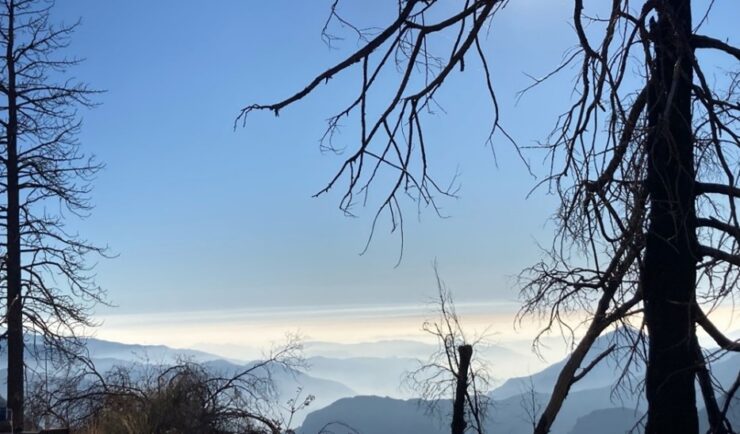
CSS employee owners supported the deployment and operation of the U.S. Environmental Protection Agency (EPA) air quality monitoring trailer (WEAVE COM – Western Enhanced Air quality VEhicle for COmmunity Monitoring) in California’s San Joaquin Valley in during late fall and early winter of 2024. Elevated particulate matter (PM2.5) is frequently found throughout the valley during…
Monitoring Algal Blooms for Harmful Toxins
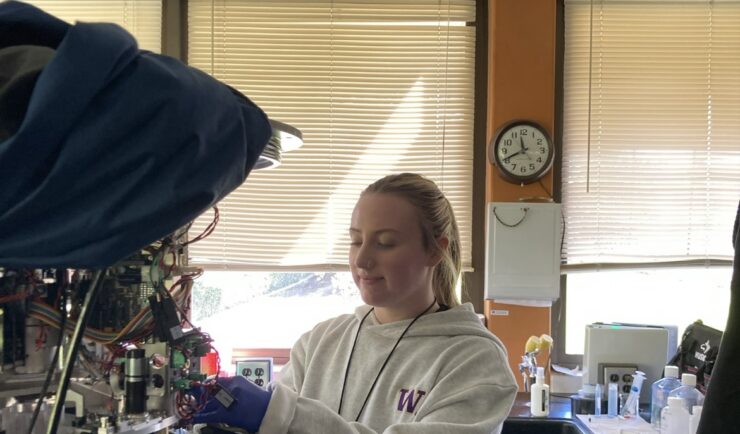
CSS employee owners support NOAA’s National Centers for Coastal Ocean Science (NCCOS) Harmful Algal Blooms (HAB) Sensor Development Team in their efforts to detect and monitor these harmful algal blooms in coastal waters where they are likely to occur. HAB monitoring is critical for detecting harmful toxins produced by some algae. When present in over…