
- Success Stories
- Satellite Science & Environmental Intelligence
Supporting the Mississippi River Basin Drought and Water Dashboard Development
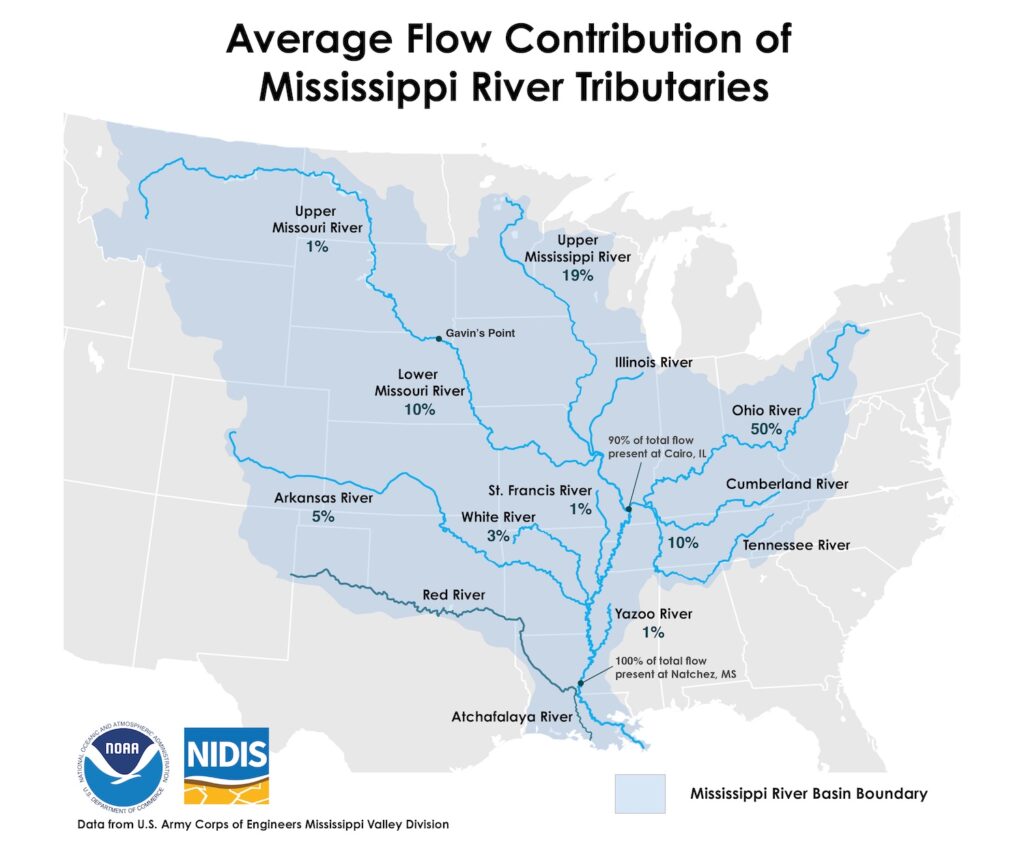
Congratulations to NOAA’s National Integrated Drought Information System (NIDIS) on the launch of the Mississippi River Basin Drought and Water Dashboard. This dashboard provides crucial, timely information to support decision-making for those living and working in the basin, which spans 31 states and 40 percent of the contiguous U.S. The team created the dashboard to curate data from across the government, offer customizable maps and images, and provide context on drought impacts. The new dashboard was officially launched at the Mississippi River Cities and Towns Initiative annual meeting on September 17, 2025.
In support of the CSS-Riverside contract with NOAA’s National Centers for Environmental Information (NCEI), CSS-Riverside staff and partners with ISciences, LLC collaborated with NOAA’s National Weather Service, the U.S. Army Corps of Engineers, the U.S. Coast Guard, the U.S. Geological Survey, state and local government agencies, and industry organizations. The project progressed from initial development and design, including a customized page menu and various map configurations, to multiple feedback sessions with stakeholders and partners. The teams incorporated this feedback to refine the dashboard’s design, content, and functionality. While navigating this process, the team also tackled several technical challenges, such as migrating server operating systems and addressing a variety of data processing and web-rendering issues to ensure the dashboard’s smooth operation.
The development team diligently worked to build a robust and user-friendly product. The group divided their talents and skills for front and back-end development. Front end development focused on creating and refining the website’s components, including map interfaces and a custom floating menu for the dashboard. Back-end development involved robust data processing, containerization, and server migration efforts to ensure reliable data streams, and a stable operational environment. The team’s cohesiveness, efficiency and attention to detail resulted in a dynamic and comprehensive resource for drought and water information.
See More CSS Insights

Fire Detection Support
CSS provides fire detection support to the Atmospheric Science and Technology Applications team with NOAA’s National Environmental Satellite, Data, and Information Services. CSS Surface Characteristics Scientist serves on the Fire Emissions and Fire Detection teams, providing data manipulation, algorithm development, and performance evaluation for the system. This ensures fast and reliable satellite data to stakeholders,…
CSS Awarded Five Year Subcontract Supporting the Bureau of Engraving and Printing
For over 22 years, CSS has supported the Bureau of Engraving and Printing (BEP). Originally as a prime contractor, CSS began supporting BEP in 2002. In November 2024, a new prime contractor, Koniag, signed CSS as a major subcontractor, which enabled CSS employee owners to continue providing comprehensive environmental, occupational safety and industrial hygiene support…
Securing and Modernizing NOAA’s Climate Data Records
NOAA’s National Centers for Environmental Information is currently migrating their monumental archives from physical data centers onto the secure Amazon Web Services (AWS) cloud, a massive undertaking to ensure these critical records remain secure. NOAA selected a CSS employee owner and program manager for Climate Data Records as a division representative for the high-stakes Data Ingest and Migration team to coordinate directly with technical experts. As part of this role, the CSS representative is also serving…